12 Attention may not increase representational precision
I said that if 2 things look the same when seen in peripheral vision with at least one unattended, but the same two things look determinately different when seen foveally and attentively, then the phenomenal precision of the attended and foveal percepts must be greater than at least one of the prior percepts. (As I mentioned, the assumption of veridicality is required to justify the imprecise representational contents of the peripheral percepts.)
It is common for philosophers to claim that attention increases “determinacy” of perception (Boone 2013; Nanay 2010; Stazicker 2011a, 2011b, 2013; but not Speaks 2010). The relevant kind of determinacy as I have been saying is precision. But it will be useful to distinguish precision from other forms of determinacy. Responses to attended stimuli are certainly less variable than responses to unattended stimuli. And attention increases acuity in the sense of spatial resolution, e.g., the ability to distinguish one dot from two dots. I will argue that spatial attention may not increase precision even if it reduces variability and acuity, and that further, in a rationally designed system spatial attention would not be expected to increase precision.
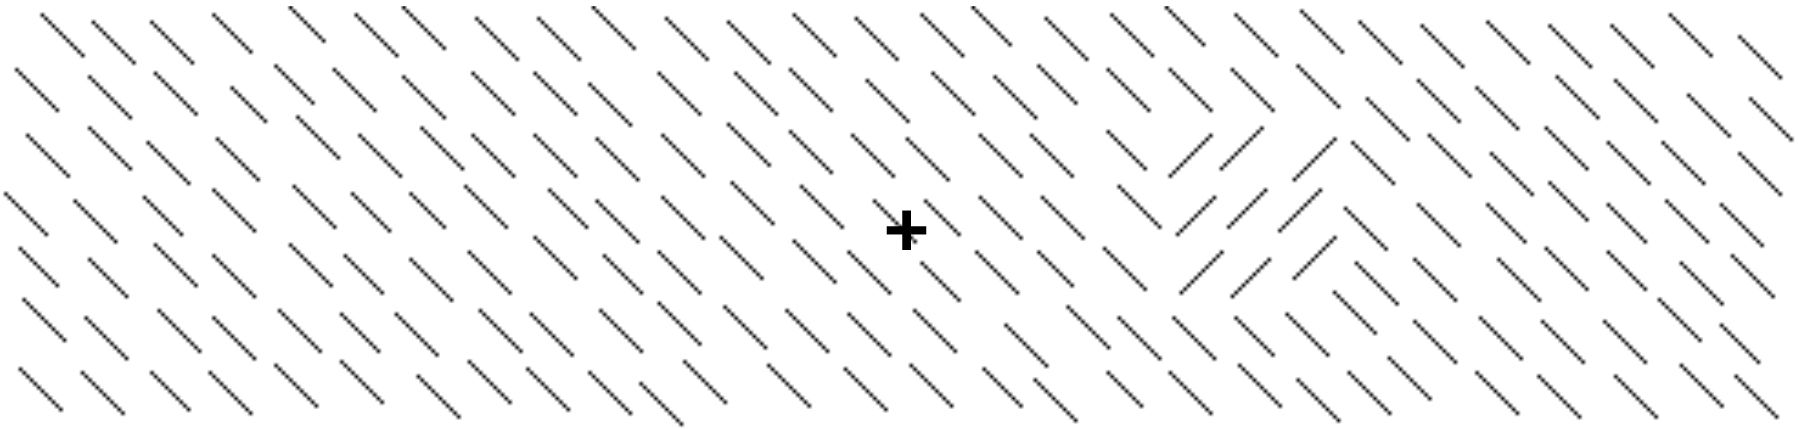 Figure 10: A textured figure used by Yeshurun & Carrasco (1998). Using stimuli like this one, stimuli were presented in which the square immediately to the right of the plus sign could appear at different eccentricities. When the resolution was low in peripheral areas, attention increased the subjects’ ability to detect the square. But when the resolution was high—nearer to the fixation point--attention decreased the subjects’ ability to detect the square because the increased resolution obscured the forest in favor of the trees.
Yeshurun & Carrasco (1998) showed that attention can increase resolution, making subjects (paradoxically) less likely to see the attended stimulus. For textured figures like the square to the right of the fixation plus sign in Figure 10, there is an optimal degree of resolution. If resolution is too high, the subjects miss the forest for the trees, failing to see the larger scale textured figures. Too low a resolution can cause subjects to miss the trees as well. Yeshurun and Carrasco presented textured figures at varying degrees of eccentricity. Since resolution is better for stimuli that are closer to the fovea, this had the effect of presenting the figures at varying degrees of resolution. They also varied resolution by manipulating where subjects were attending, using cues of the sort described earlier. Putting together the contributions to resolution from eccentricity and attention, they were able to show that there were different optimal degrees of resolution for different figures.
One neural mechanism by which attention increases resolution is shrinking of the “receptive fields” of neurons in the visual system. Recall that a receptive field is the area of space that a neuron responds to. Resolution increases when neurons respond to smaller areas. Another mechanism is the shifting of receptive fields from adjacent areas that was mentioned earlier.
As I mentioned, the sensitivity of high “spatial frequency” channels increases—probably as a result of these mechanisms. Recall that spatial frequency in the case of a stripy stimulus like the “Gabor patches” used in many of the figures In this article (e.g., Figure 15) is a measure of how dense the stripes are. Boosting the sensitivity to high spatial frequencies makes resolution higher, thereby improving perception of textured figures when the resolution is too low and impairing perception when resolution is too high. The Yeshurun and Carrasco paper concerns exogenous attention. Later work (Barbot et al. 2012) shows that endogenous attention is more flexible, raising or lowering the sensitivities of high spatial frequency channels so as to improve perception.
I mention the increase in resolution and the sensitivity to high spatial frequencies in order to be sure that the reader is distinguishing these matters from an increase in precision.
Representational precision is a matter of how wide a range of values is allowed by the representational content, what values are compatible with the veridicality of the percept. (Phenomenal precision is a matter of “crispness” of the appearance.) One dot and two dots may look the same in peripheral vision even though we can clearly see the difference in foveal vision. That is a difference in acuity rather than a difference in precision. Increasing precision for representation is sharpening the representational content.
The relation between variability and precision is more complex. Imprecision is often cashed out in terms of reliable correlation between a representation and the world (Stazicker 2013). In that sense, since attention decreases variability it must increase precision. However, there are different sorts of noise. As we will see in the first experiment to be described below, attention may decrease noise across the whole spectrum without affecting what might be thought of as intrinsic variation in the signal and thus not increasing a kind of systematic precision. As I will explain, the experiment to be described helps us to precisify what precision comes to.
I will describe two experiments that will help to make the notion of precision more precise or at least concrete and will suggest that spatial attention does not narrow representational precision. Before I do that, let me say briefly why one should expect that spatial attention will not make the attended properties any more precise. Increasing precision normally involves suppression of responses outside the expected range. It would not make sense for a system to be designed to suppress some values without some indication of the irrelevancy of those values. Spatial attention tunes for spatial area, suppressing responses to other spatial areas (Montagna et al. 2009). So spatial attention can be expected to increase precision for spacial location but not for contrast, size, spatial frequency or speed.[16] For feature-based attention, the opposite is true. If one is looking for the red thing, it makes sense to suppress sensitivity to other colors. Spatial attention should tune for space only and feature-based attention should tune for the property attended to.
The first experiment uses the “attentional blink”, a phenomenon in which there is a series of stimuli and two targets amid distractors. In part of the experiment, the targets were squares and the distractors circles. The general finding is that if the subject consciously sees the first target square, and if the second target square is presented 200-400 ms after the first square, the subject will be much less likely to consciously see the second square. The mechanism has been shown to depend on the first target absorbing the subject’s attention so that there is insufficient attention to consciously see the second square. The second square is described as “blinked”, where the blinking deprives the square of attention. Asplund et al. (2014) used this technique with a paradigm in which the target squares were colored and in which subjects had to report the color of the second square by moving a mouse to click on a color wheel that had 180 colors on it. The idea is that the effect of attention on how intervalic the perceptual representation is could be assessed by examining the effect of the presence or absence of attention on the precision of subjects’ identifications of the color using the color wheel.
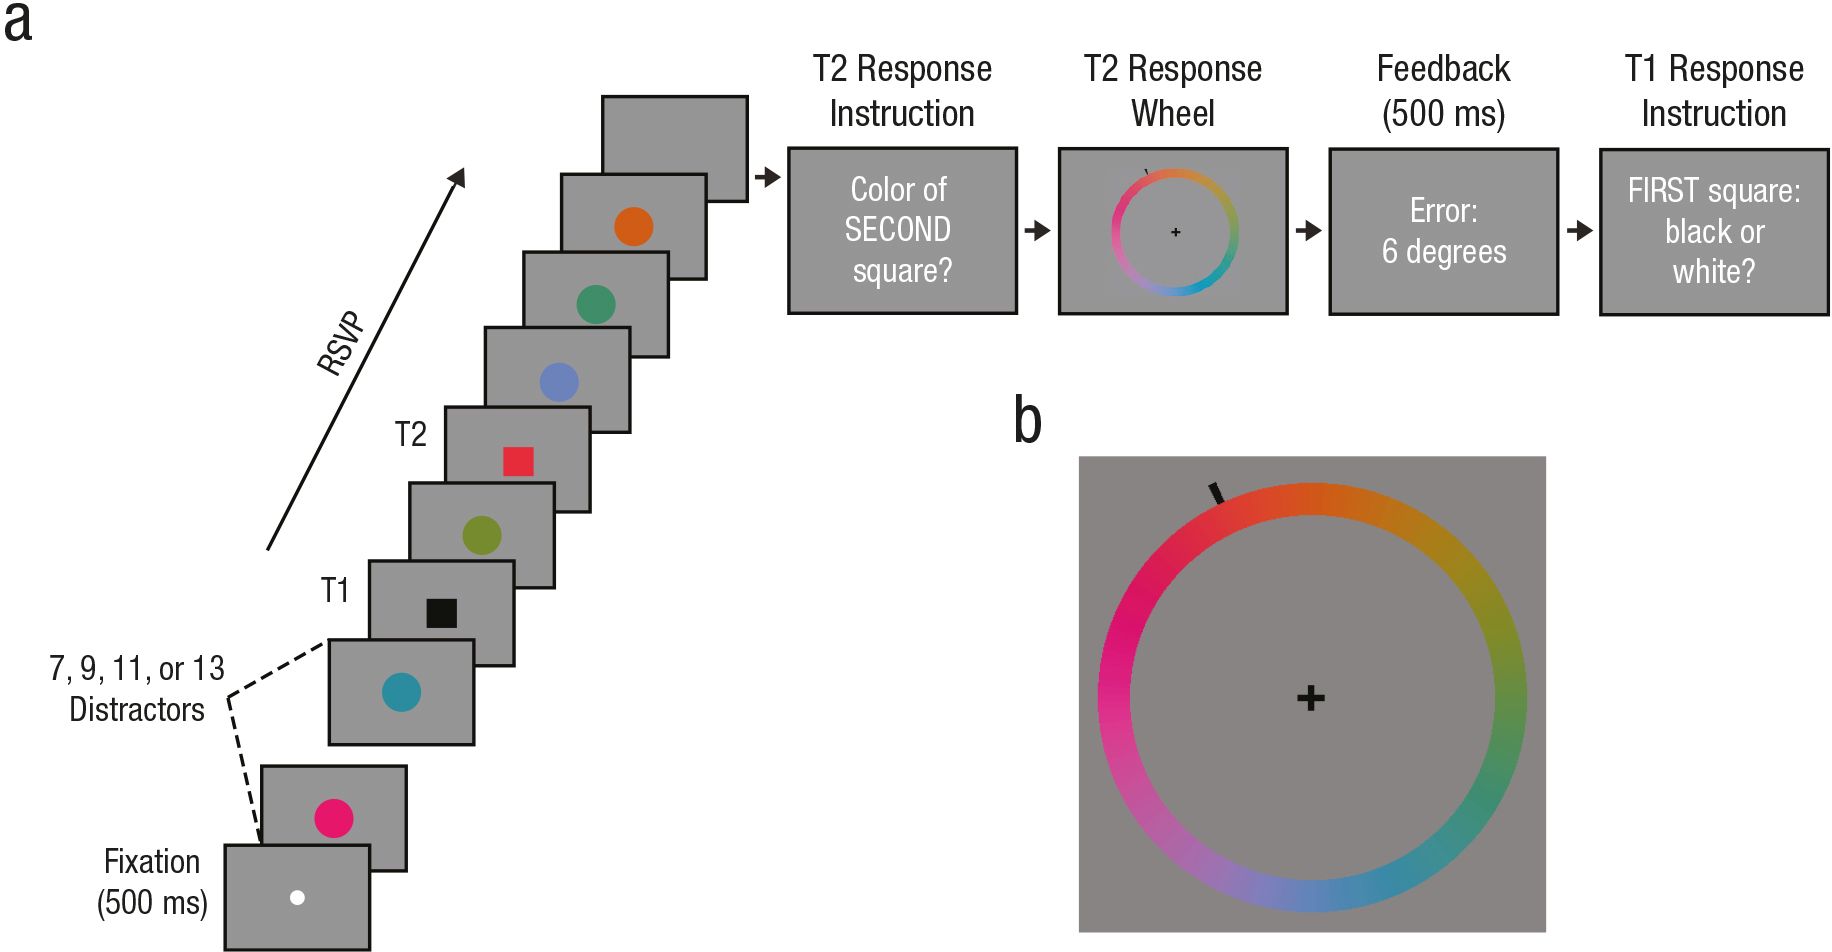 Figure 11: Procedure from Asplund et al. (2014). Understanding of this diagram is aided by color reproduction. Thanks to Chris Asplund for supplying this figure.
The experimental procedure is diagrammed in Figure 11. The subject saw a fixation point (lowest square on the left). Then there were 7-13 colored disks, then a target, T1, a square that was either black or white (RSVP = rapid serial visual presentation), then some number of colored disks, then another square, then 3 more disks. Then subjects reported the color of T2 using the color wheel. They got immediate feedback in how far off they were on identifying the color (in degrees on the color wheel) for 500 ms, then they indicated whether T1 was white or black. If the subject got T1 wrong, that trial’s report of T2 was disregarded. This design allowed for comparison of precision of reporting the color of T2 between trials in which attention was maximally reduced (T2 presented 2 items after T1, described as “lag 2”) with trials in which the lag was so long or so short that there was no attentional blink at all. The key result is that although the lag time was strongly correlated with the average correctness of the response (as always in the attentional blink), the precision of the responses that were not random was not affected significantly. The same experiment was done with faces using a slightly different form of the attentional blink. T1 was one of two faces that subjects had to recognize and the response wheel for T2 had a series of 150 face morphs based on 3 faces, with 49 intermediate faces interposed between them. The results were the same with faces as with colors. The key result for both studies is that the identification of T2 was either random (much more likely at the critical “lag 2” for an attentional blindness effect of 200-400 ms) or just as precise at lag 2 as at lag 8. Note that the experiment does not directly test the precision of any single percept. The assumption is that the precision of representation of a blinked color will be reflected in how tightly clustered the different responses are. Asplund et al. (2014) conclude (p. 6): “Across both stimulus classes (colors and faces) and experimental designs …, we found that the reported precision of a target item is not affected in the AB [attentional blink], even though our paradigms had the sensitivity to detect such effects.”
But wait, you may ask: “Didn’t I say that attention decreases variability? And why is there supposed to be a difference between (the inverse of) variability and precision?” (Indeed, the inverse of “variance”, one measure of variability, is a common notion of precision.) The answer is that if you look at the raw data in this experiment, the blinked color identifications are much more variable than the ones that are not blinked. However, the authors were able to show via modeling that the response distribution was a superimposition of two very different distributions. One distribution was uniform over the whole color wheel with no clustering around one color, whereas the second distribution was tightly clustered around the correct color, just as tightly as when the color stimulus was not blinked. They reasoned that the first (random) distribution represented cases in which the subject simply did not see the stimulus. However, when the subject did see the stimulus, the precision of the response was just as if it had not been blinked. (They considered and rejected a “variable precision” model that predicted the data less well; van den Berg et al. 2012). So overall variability of response is not a good guide to the precision of the representation. And this shows an important flaw in crude correlational approaches to precision. The precision of a perceptual representation should not be taken to be a matter of how well perceptual representation correlates with stimuli since what is really relevant is the cases in which the subject actually sees the stimulus.
This point is illustrated in Figure 12 in which the response error profile for lag 2 in which the attentional blink is most powerful is compared with the response error profile for lag 8 in which the attentional blink is least powerful. The widths of the distributions are the same. What differs is the number of random responses as indicated by the higher “tails” of the distributions.
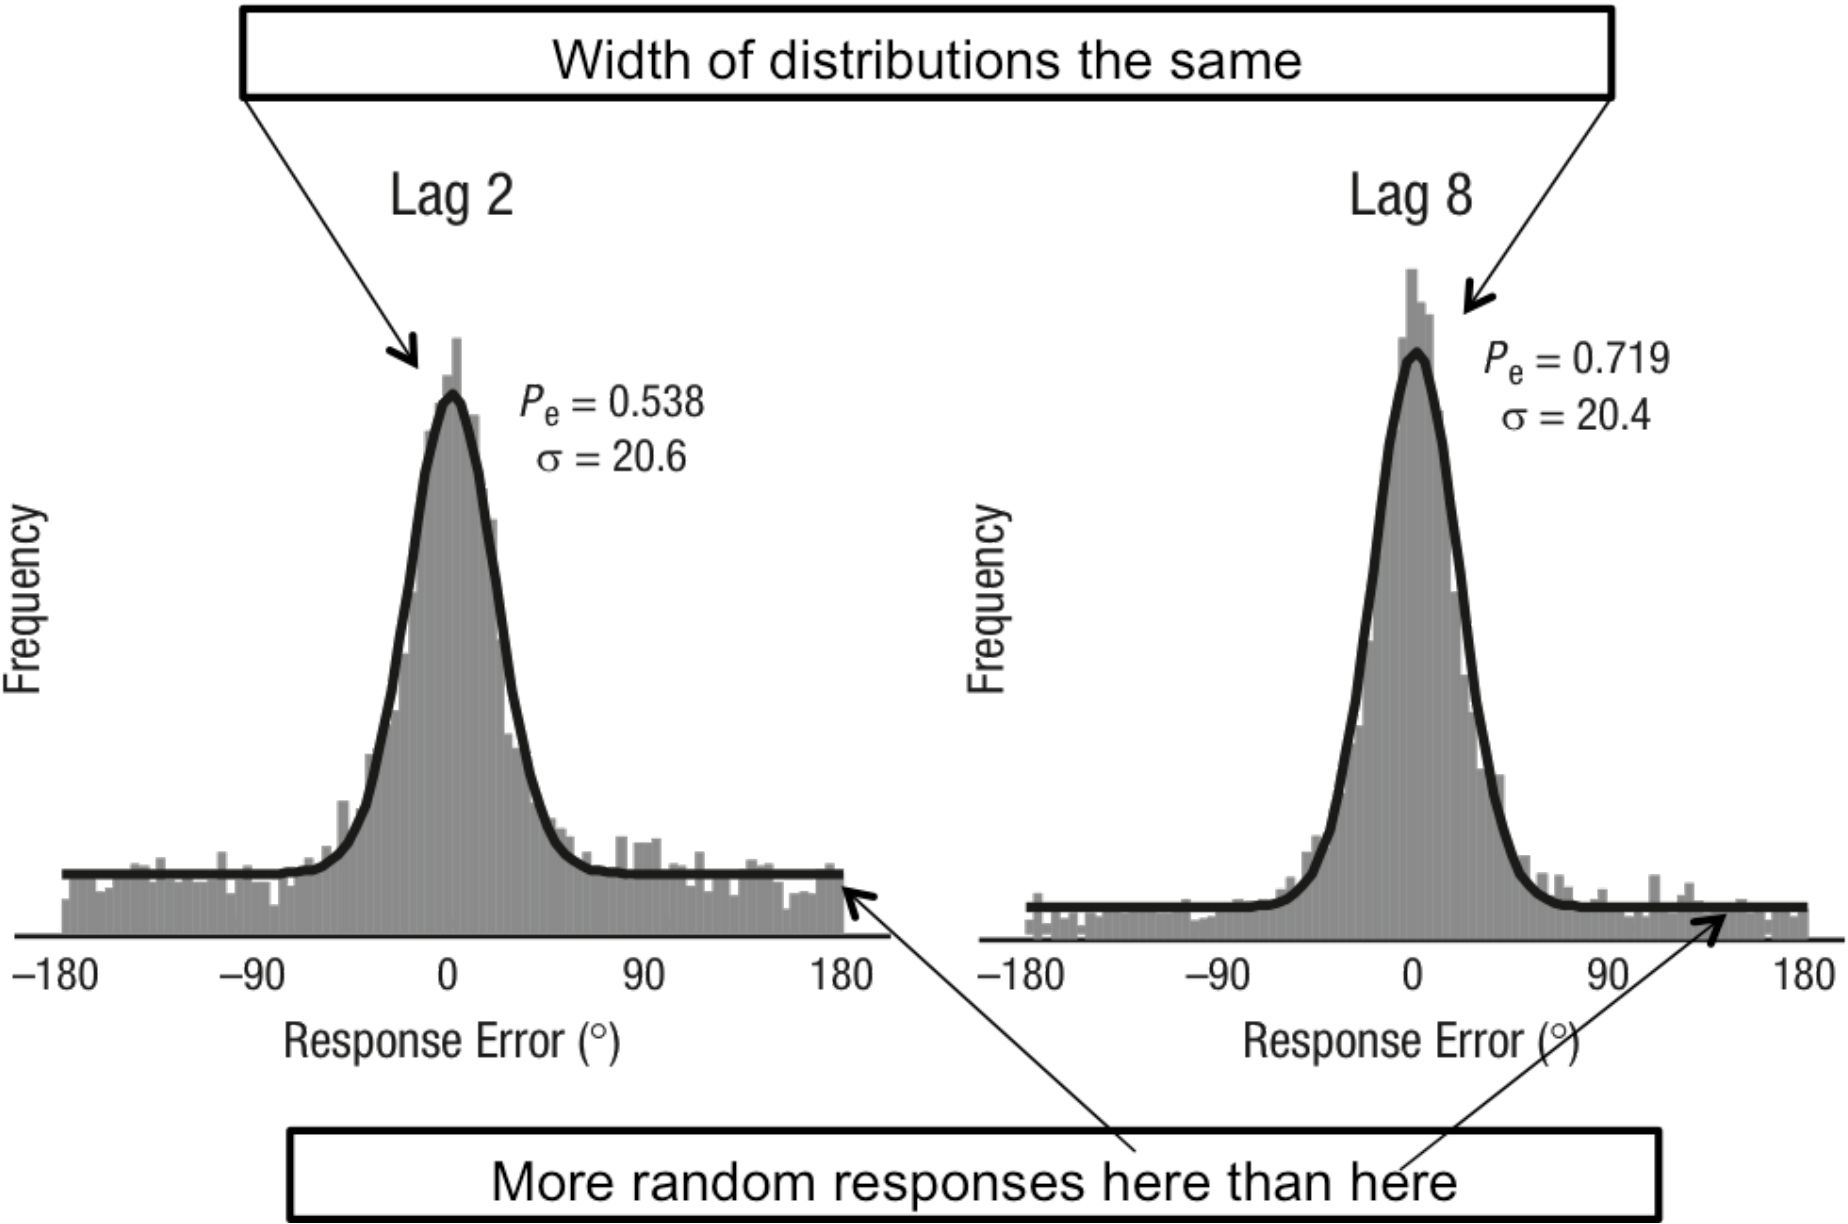 Figure 12: This is a modified form of a figure from Asplund et al. (2014). The figure compares response errors for lag 2—the value with the maximum effect of the attentional blink with lag 8—the value with the minimum attentional blink. What the figure shows is that the precision of the responses in which the subject actually saw the stimulus was the same. And the figure shows an increase in random responses for the blinked stimulus. Thanks to Chris Asplund for supplying the figure which has been modified here.
Note the difference between precision and veridicality in this experiment. Precision is a matter of how tightly the responses cluster and veridicality is a matter of whether the responses cluster around the value of the item that was seen regardless of how tightly they cluster. If the color seen was focal red, responses could pick out focal green in a very precise manner, but be non-veridical nonetheless. Conversely, the average of the responses might be the color seen (focal red) and thus the responses are on the average veridical even though the intervalic content is very wide.
An objector might say that the cases in which the blinked stimulus is reported in a non-random manner might be cases in which it was not in fact deprived of attention by the first percept. Imaging studies of the attentional blink do suggest a general deprivation of attention of the blinked stimulus (Sergent et al. 2005) but I don’t know of one that looks specifically at this issue. There are always potential confounds and the general remedy is to approach the same issue in more than one way. In the case of this result, the same conclusion has been reached by approaches that do not share vulnerabilities.
Another approach recorded from single neurons in a monkey visual area (V4) that is known to be sensitive to shape and form (David et al. 2008). Orientation tuning was not narrowed by spatial attention, but it was narrowed by attention to a specific orientation—feature-based attention. A recent review (Ling et al. 2014) summarizes this approach as follows:
Although initial physiological reports suggested that directing spatial attention to an item sharpens the band-width of orientation-selective cells in macaque visual area V4…, this was later shown not to necessarily be the case. Follow-up studies using a more sensitive measure for tuning bandwidth found no effect of spatial attention on the width of the orientation tuning function... Rather, these studies instead only found changes in the responsivity and baseline firing rate of neurons coding for the spatially attended location. Thus, the neurophysiological evidence appears to indicate that spatially attending to a location leaves a neuron’s feature tuning unaffected.
A psychophysical study came to the same conclusion, that spatial attention boosts activation but not precision.
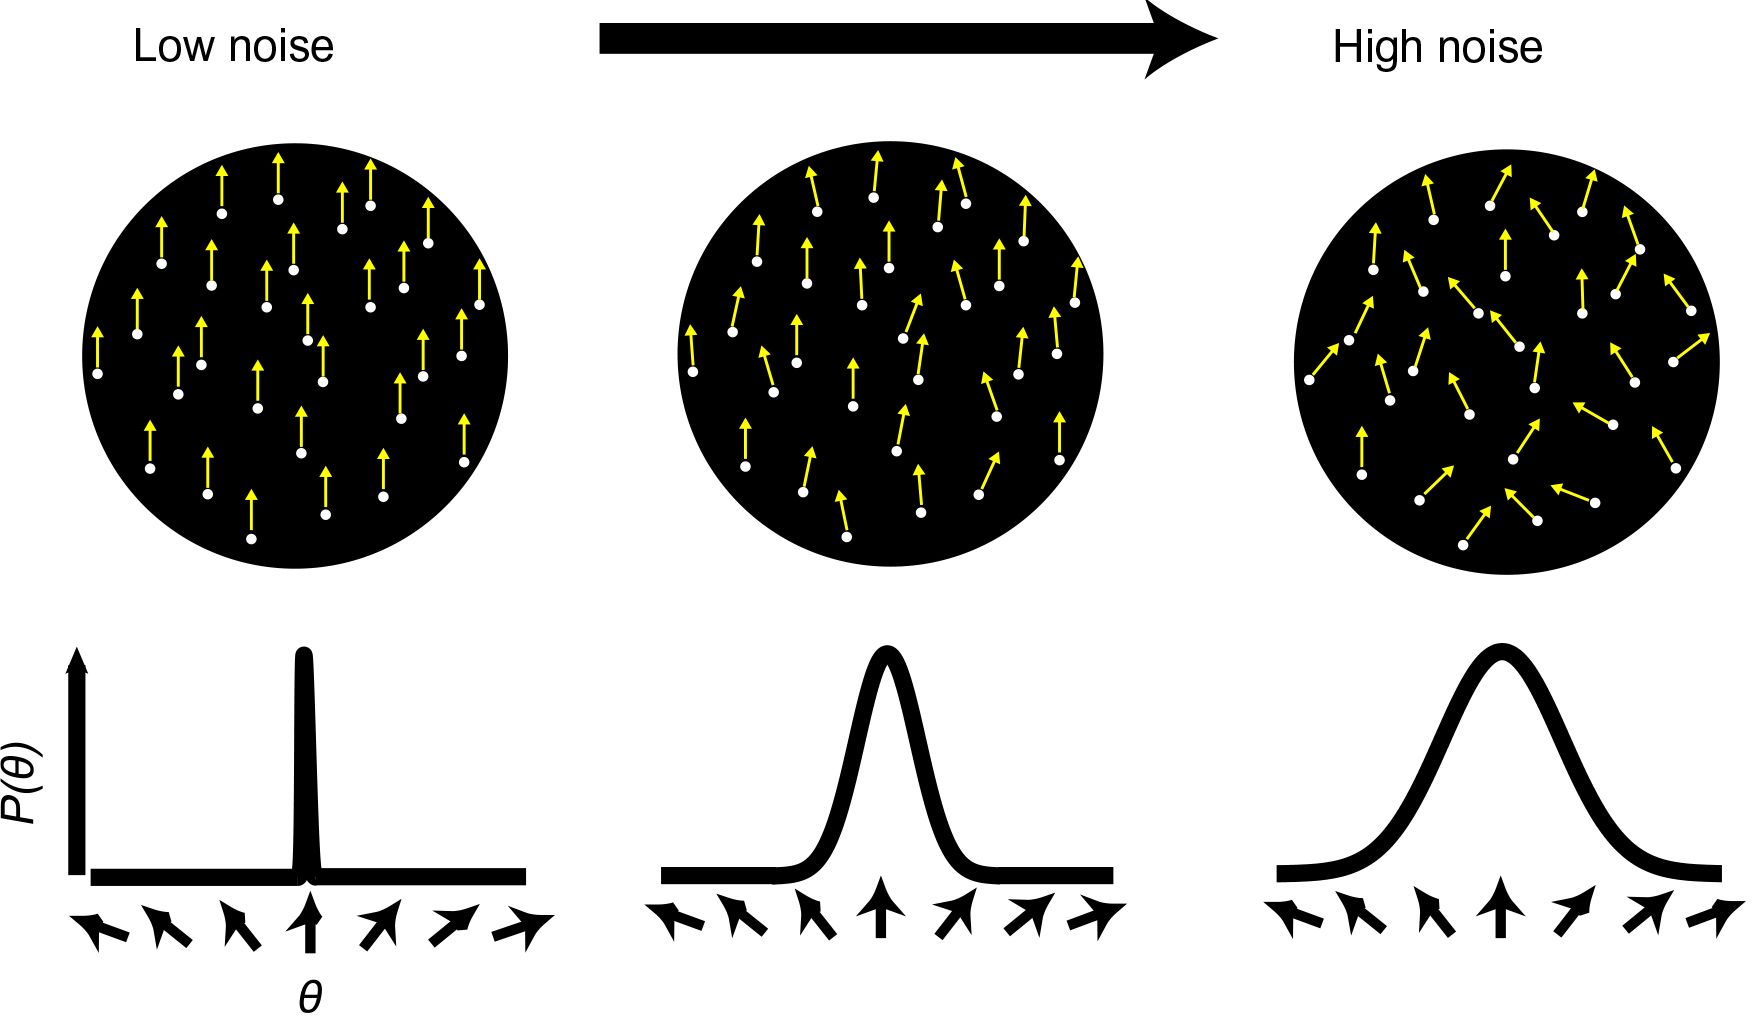 Figure 13: Random-dot cinematograms in which dots exhibit local motion. In the low noise condition, most of the dots are moving in the same direction. As noise increases, the spread of directions increases and motion coherence decreases. From an experiment comparing spatial attention with feature-based attention. With permission of Vision Research.
Ling et al. (2009) contrasted spatial and feature-based attention. The stimuli were random-dot cinematograms in which dots move in one direction or another for short distances. In the low noise condition shown on the left side of Figure 13, the dots show a high degree of coherence in that most of them move in the same direction. As noise increases, motion coherence decreases. Subjects had to make a series of judgments of the orientation of overall motion of these cinematograms. In the spatial attention version, they could be cued as to the place the stimulus would appear. In the feature-based attention version, they were cued to one of four directions of motion and had to report the observed motion as a clockwise or counterclockwise deviation from the cued motion. Ling et al. were especially interested in comparing two different models for how attention boosts performance in detecting the direction of motion, using stimuli that could move in different directions. See Figure 14.
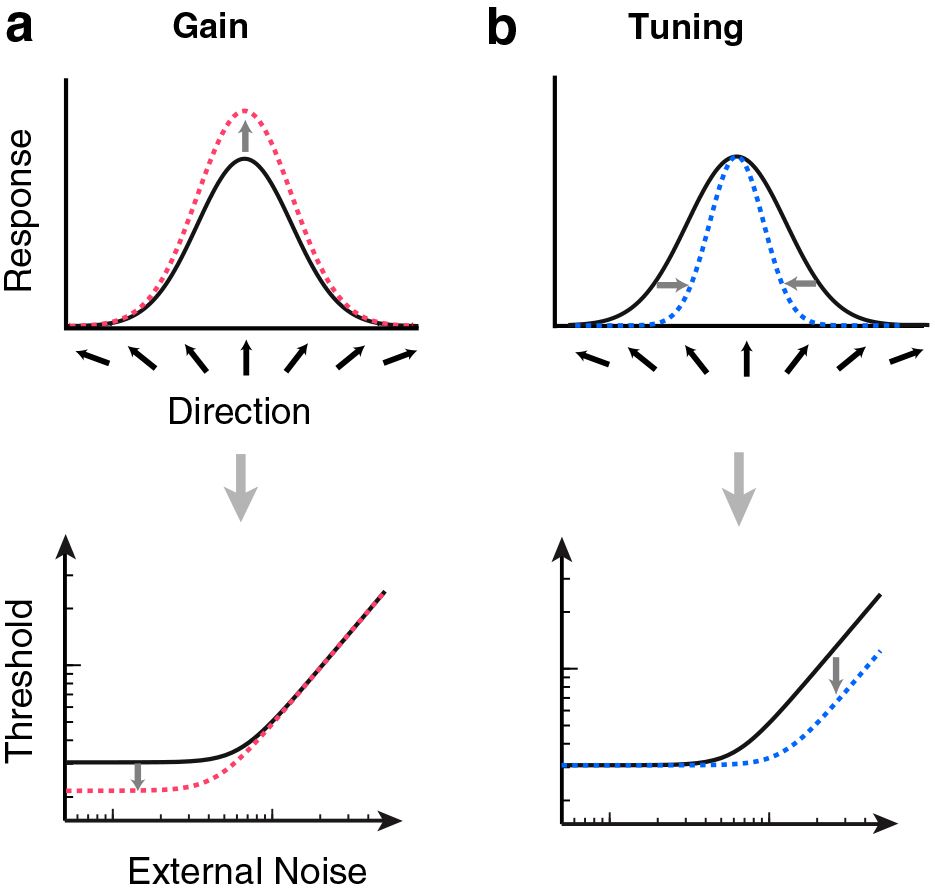 Figure 14: Two models of how attention boosts performance. According to the gain model indicated in the top left (a), the boost derives from increasing the firing of all directional feature detectors. The arrows along the x-axis indicate receptors for motion in different directions. The dotted lines represent the change due to attention (as compared with the solid lines). The tuning model at the top right (b) says performance is boosted by sharpening the response, decreasing the range of the intervalic content, as indicated by the narrowed shape of the dotted line. See the text for an explanation of the bottom diagrams. From Ling et al. (2009). With permission of Vision Research.
According to the gain model of (a), the response to the stimulus is increased as if the volume—i.e., the signal strength—were simply turned up equally for all movement-direction detectors. (Orientations of motion are indicated by arrows along the x-axis. The signal strength was turned up in the sense that the signal strength prior to attention is multiplied by a constant factor. For the values that are already high—i.e., at the peak—the multiplying a large value by a constant factor has a bigger effect than at the tails of the distribution where multiplying the constant factor times a zero yields zero.) According to the sharpening model of (b), the effect of attention is not to turn up the response but rather to suppress the irrelevant noise in the stimulus, narrowing the intervalic range of the response profile. These two models make different predictions for “threshold vs. noise” curves pictured in the bottom of Figure 14. The gain model predicts an increase in discriminability only when the external noise is low compared with internal noise. When external noise is low, there is a benefit to turning up the volume— even though the volume increases both signal and external noise—since the effect of turning up the volume is to “swamp” the internal noise. (Internal noise is a blanket term for variation in the visual system, whatever makes visual responses vary even when the external signal remains the same.) As external signal and noise dominates the percept, internal noise decreases in importance. This kind of gain has a similar effect as decreasing the internal noise. If internal noise were zero, there would be no benefit at all in raising the volume on both the signal and the noise. The benefit of raising the volume however dwindles away as external noise increases since the increase in volume increases the effects of external noise too. This is indicated by the lowered threshold on the bottom left of (a) where the advantage in lowering the threshold decreases as external noise rises.
A different picture emerges from the model of the bottom right (b) where the benefit of tuning is greatest when external noise is greatest. (Note that if there is no external noise, tuning is of no benefit.) Thus the benefit should increase as noise increases as pictured in the bottom right (b). These models were tested by a procedure somewhat like that in Figure 5, except using voluntary attention. A line indicated where the subjects were supposed to attend and then a tone indicated that the stimulus was about to appear. Subjects could be cued to one of 4 locations where their task was to report the direction of motion of a stimulus. Sometimes there was a tone but no cue. The result was unequivocal: a pattern like that of the bottom left of Figure 14, indicating an effect of gain but no tuning. “The data showed that spatial attention yielded benefits strictly with low external noise, and no benefits with high external noise” (Ling et al. 2009, p. 1201). They also used the same setup with feature-based attention in which the subjects were cued with an indicator of what the direction of the stimulus would be. In this version, there was both tuning and gain, showing a hybrid of the patterns of a and b in Figure 14.
Again, spatial attention does not appear to narrow representational precision, contrary to the representationist position. This is graphically shown in the tuning model of Figure 14: suppression of values outside the selected value directly reduces precision. This is what does not happen with spatial attention.
But why does this result concern representational precision rather than phenomenal precision? I considered an analog of this question concerning peripheral vision in section 2. There I noted that the anatomical asymmetries that are the probable basis of the inhomogeneities discussed are bound to affect unconscious perception in the same way as conscious perception. And a similar point applies here. The narrowing of receptive fields that is the main underlying mechanism of the attentional effects concerns perception simpliciter rather than conscious perception per se. As I mentioned earlier, spatial attention operates in unconscious perception in a similar manner to conscious perception (Chica et al. 2011; Kentridge et al. 2008; Norman et al. 2013).
The dimensions used in both of the experiments described are “metathetic” as opposed to “prothetic” (Stevens & Galanter 1957). Prothetic dimensions have a zero point and intrinsic directionality, whereas metathetic dimensions have neither (Fuller & Carrasco 2006). Color saturation is prothetic because there is a zero point—achromaticity—and colors are more or less saturated. Hues are metathetic. At least for primary hues such as red and green, neither has more of any hue. Carrasco’s work shows that the attentional effects involved in increasing size, speed, flicker rate and the like work for prothetic dimensions like color saturation but not metathetic dimensions like hue (Fuller & Carrasco 2006). And that fact leads to the question of whether the conclusion that attention does not change precision depends on the magnitude tested being metathetic.
The studies on prothetic dimensions are not as easy to interpret as the ones I just described. One reason is that for metathetic dimensions, the psychological meaning of a difference is roughly the same throughout the dimension. A 90o shift in direction has roughly the same significance independently of the starting direction. But for prothetic magnitudes that is dramatically not so. A one inch change in a length of .01 inch has a different psychological significance than a one inch change in a length of one mile. Baldassi & Verghese (2005) give some evidence that spatial attention does not change the intervalic range of detection of contrast—a metathetic magnitude—though feature-based attention does narrow intervalic range.
The review I mentioned (Ling et al. 2014) surveys many different studies on this issue, concluding (references removed):
By and large, studies using psychophysical techniques to assess selectivity have converged on results that square quite nicely with the neurophysiological results…: feature-based attention to an item selectively changes psychophysical tuning curves…, while directing spatial attention to that item leaves behavioral feature tuning untouched…
I mentioned that increasing precision normally involves suppression of responses outside the expected range. There is no reason for spatial attention to increase the precision of anything else other than spatial area. In particular, why would spatial attention suppress some directions of motion and not others? However if attention is directed towards motion in a certain direction (feature based attention) then increasing precision does make sense. The point applies equally to prothetic as to metathetic dimensions. Why should spatial attention tune for some values but not others of contrast or gap size given that tuning involves suppression of some range of contrasts or gap sizes. So there is good reason to expect these results to apply to prothetic dimensions.
Let me return to the issue of peripheral perception as compared with foveal perception. I mentioned the experiment that shows that discrimination of contrast in the periphery is as good as in the fovea. But there is an additional fact about peripheral vision, a phenomenon of “crowding” in which things lose the quality of ‘‘form...without losing crispness...’’ (Lettvin 1976). We can ignore crowding for the purposes discussed here so long as we confine ourselves to perception of what the visual system treats as single objects. For more on this, see Block (2012, 2013).
To conclude, there is evidence that attended and foveal perception can be greater in phenomenological precision without being greater in representational precision, contrary to representationism. In direct realist terms, there is evidence that attended and foveal perception can be greater in phenomenological precision without involving awareness of more precise environmental properties.