2 Two case studies or how we deal with error
The study of geometric illusions or overestimation of slope, distance, and size as a function of situatedness misleads us into believing that perception normally reveals the true state of affairs. The finding that golf holes look slightly bigger to experts as compared to inexperienced golfers is spectacular because and only if we assume that perception is normally veridical. This is, however, not the case. Normally, our grasp of the physical world is rather limited. I present novel data from two everyday domains that differ from the standard examples of intuitive physics in a crucial way. They deal with the understanding (first case study) and the perception (second case study) of relational properties, rather than with more straight-forward perception of simple properties. Seeing the color of an object or its size, predicting its motion trajectory, etc., refer to simple properties. Most everyday activities, however, involve relational properties. We need to see and predict how we might interact with objects in the world. This interaction depends on our own makeup, on the object’s properties, and on the relation between the two. For instance, to judge whether a slope might be too slippery for us to walk on depends on the quality of the soles of my shoes, the surface texture of the slope, and also on their interaction. A polished hardwood ramp may be slippery if I am wearing shoes with leather soles, but it may be very sticky if I am barefoot.
The two case studies that follow are intended to illustrate in detail how limited our understanding of relational properties is in general, and to show that we have to make decisions in the face of poor perception that may have serious consequences.
2.1 Case study: Balancing as a relational property
Before you read on, please take a minute to solve six questions about the depicted falling rods. Solutions will be provided later. Note that in tasks 1 through 3 (see Figure 12, 13, 14), the scenario is as follows. Two rods are held upright, but they are very slightly tipped to one side (by exactly equal amounts), such that they will fall once released. They are released at exactly the same moment. Which one will hit the ground sooner? In tasks 4–6, you are to judge the ease of balancing such a rod on the tip of your index finger.
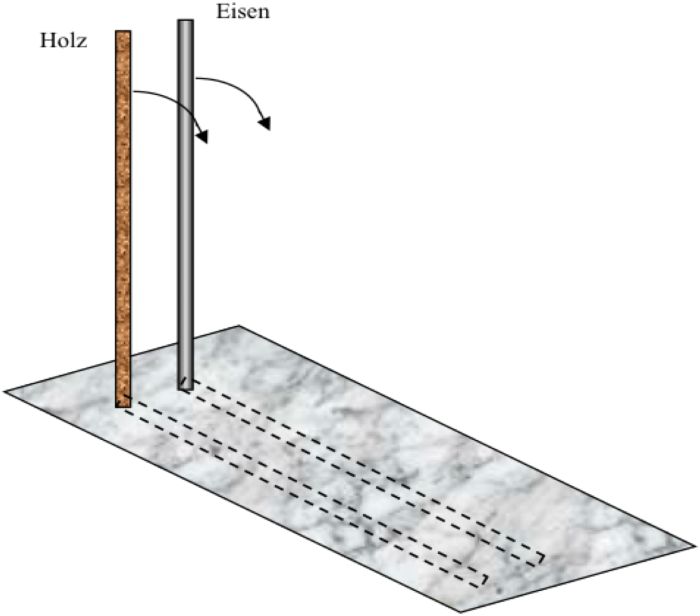 Figure 12: Task 1: The rod on the left is light, it is made of wood; the rod on the right is heavier because it is made of iron. If they begin to tip over at the same moment in time, which one will fall faster?
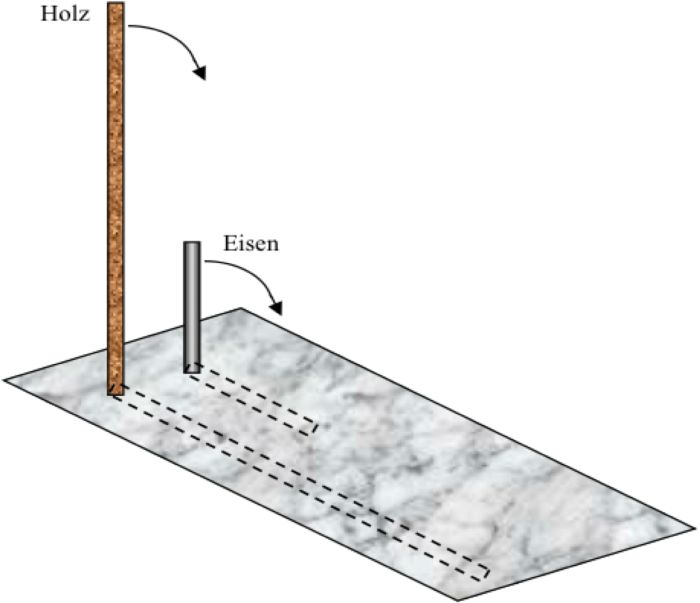 Figure 13: In Task 2 the rods are equally heavy but have different lengths. The left rod is made of wood; the rod on the right is shorter but has the same weight as it is made of steel. Which one will fall faster?
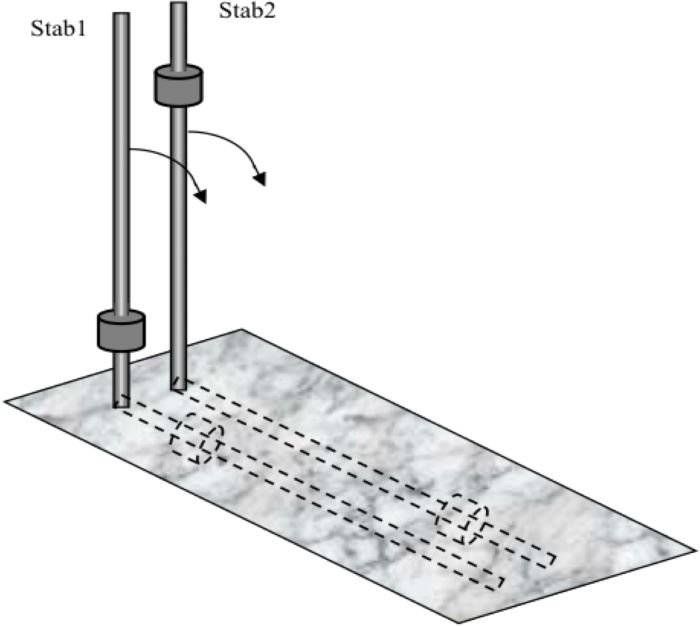 Figure 14: In Task 3, the two rods are identical in material, length, and weight. An additional weight is attached either at the bottom or at the top. Which rod will fall faster?
Task 4 asks about the same rods as in Task 1, but the question is whether the wooden or the steel rod would be easier to balance on the tip of your index finger.
Task 5 asks whether the short steel rod or the longer wooden rod of equal weight would be easier to balance on the index finger. And finally, Task 6 asks whether a weight attached to a given rod would make it easier to balance, and if so, where it best be attached (top, center, bottom). In a large survey, we tested the intuitive knowledge of a large number of college students about these tasks. Note that we tested such that each subject only had to solve one of the six tasks.
2.1.1 Methods detail
180 college students (123 women, 57 men, age M = 24.9 SD = 5.9, ranging from 18 to 53 years) volunteered to participate in the survey. We used a paper-and-pencil test to investigate the subjects’ knowledge and to obtain their estimates about which objects would be easier to balance. The six tasks were explained carefully and illustrated with drawings similar to those shown in Figure 12, 13 and 14.
Each task was presented to 30 students. Tasks 1–3 were used to test intuitive knowledge without referring or alluding to the act of balancing. Merely the process of falling from an almost upright position to a horizontal position had to be judged. In the first task (Figure 12), subjects saw two rods of equal length (1m) but of different material and weight. The wooden rod was said to weigh 40g, the steel rod 400g. The accompanying information text indicated that both rods were slightly tipped over at the exact same time, for instance by a minimal breeze. The wooden rod was to take exactly 1.5 seconds to fall from its upright position to the horizontal. We had tested the falling speed of such rods and measured it to be approximately 1.5s. The subjects were asked to estimate the fall-duration of the steel rod. The second (Figure 13) task showed two rods of equal mass (40g) but different length (rod 1 = 100cm, rod 2 = 36cm). The information text was the same as in Task 1. The third task (Figure 14) showed two rods of equal length (1m) and weight (220g). However, an additional small object (220g) was placed respectively toward the top or the bottom of the rod (rod 1 = 10cm from the bottom, rod 2 = 90cm from the bottom). The accompanying information text indicated that both rods would be tipped over by a minimal breeze and that it took rod 1 exactly 1.5 seconds to fall to a horizontal position. Subjects were to estimate the fall-duration of rod 2.
Tasks 4–6 used the same rods but the questions about them were couched in the context of balancing. This should evoke experiences that subjects may have made when balancing or hefting objects. Thus, rather than asking which rod would fall quicker, we asked which would be easier to balance.
The fourth task showed the same two rods of equal length (1m) but different weights (wooden rod = 40g, heavy steel rod = 400g) that had been used for Task 1 (Figure 12). The subjects were asked to indicate which rod they thought they could better balance on the tip of one finger, typically the index finger. The possible answers ranged from 1 (“rod 1 much better than rod 2”) to 7 (“rod 2 much better than rod 1”). The fifth task (Figure 13) showed two rods of equal weight (40g) but different length (rod 1 = 100cm, rod 2 = 36cm). Again, the subjects were asked to indicate which rod they could better balance with one finger. Task 6 showed one rod (length = 1m, weight = 220g). Subjects had to indicate the position that they would place an additional small object (mass = 220g) to get optimal balancing characteristics (from 10cm = bottom to 100cm = top). It was made clear that the weight would not come into contact with the balancing hand even when it was placed at the bottom.
2.1.2 Results
People who cannot draw on formal physics training to answer the six tasks have a rather poor intuitive understanding of falling rods. Neglecting air resistance, the rate of falling is determined by how high the center of gravity (barycenter) is above the ground. The rod’s mass is irrelevant. Thus, rods of equal length (mass distribution is assumed to be uniform) fall at the same rate, but the shorter rod falls quicker than its longer counterpart. By the same token, a weight attached to the tip of the rod should cause it to fall more slowly because it moves the barycenter closer to the tip.
In general, the subjects estimated their knowledge in the natural sciences to be moderate when asked to judge it on a six-point scale ranging from very poor (1) to very good (6). Mathematics knowledge (M = 3.62, SD = 1.13) was judged better (t(179) = 11.98, p < .001) than physics knowledge (M = 2.56, SD = 1.26). The men estimated their knowledge somewhat higher than did the women, for physics (t(178) = 8.8, p < .001) and mathematics (t(178) = 2.34, p < .05).
Task 1: In reality, both rods fall with the same speed, as Galileo Galilei showed in 1590 with the help of several experiments about free fall (e.g., Hermann 1981). The falling speed is independent of their mass as long as air resistance is negligible. Thus, 1.5 seconds was the right answer. 40% of the test subjects answered correctly. 43.3% estimated that the heavier rod would fall faster, while 16.7% estimated that it would fall more slowly.
Task 2: Because of the lower barycenter the shorter rod falls faster and its fall-duration is briefer than 1.5 seconds. 46.7% of the test subjects indicated this. 44.3% thought that the fall-duration would be the same and 10% estimated that the shorter rod would fall more slowly.
Task 3: Because of the higher barycenter, the second rod falls more slowly. Therefore, its fall-duration is longer than 1.5 seconds. Only 20% of the subjects chose the right answer. 50% estimated that the rod with the higher barycenter would fall faster and 30% estimated that it would fall at the same rate.
There is a direct link between the fall-duration of an object and the ability to balance this object. The longer the fall-duration, the more time there should be to move the balancing finger right underneath the barycenter, and hence the easier to balance (a moderate weight assumed). We confirmed this hypothesis empirically in several experiments where subjects actually had to balance different rods to which weights were attached at different heights. Thus, we can predict the ability to balance different objects by comparing their fall-duration.
Task 4: Here, the rods (same length, different weight) had the same fall-duration—so the ability to balance them can be assumed to be the same, too. This was recognized by only 3.3% of the test subjects, while 73% favored the heavier rod, and 23.3% the lighter one.
Task 5 (two rods, same weight, different length): Because of the longer fall-duration the longer rod is easier to balance. This was assumed by 56.7% of the subjects. 20% estimated both rods to be equal and 23.3% thought the shorter one would be easier to balance.
Task 6 (additional weight): The higher the barycenter the longer the fall-duration—and with it the ease of balancing. Therefore, the additional object should be placed at the top of the rod. This was indicated by 33.3% of the test subjects. The majority of 43.3% chose the bottom for placing the object, and 23.3 % chose positions between bottom and top.
In sum, the intuitive knowledge about the fall of different objects is rather spotty. About half of the subjects knew that fall-duration is independent of mass (Task 1) and that shorter objects fall faster (Task 2), only 20% realized that the position of the barycenter is relevant and that the fall-duration increases when the barycenter is shifted to the upper end of the rod (Task 3). This is remarkable because on a daily basis we handle objects whose barycenter differs from the geometrical center, for instance a filled vs. an empty soup ladle, top-heavy tennis rackets, etc.
Asking directly about the act of balancing did not reveal superior understanding. When asked about their ability to balance objects, people do know that longer objects are easier to balance than shorter ones, but they do not seem to realize that the mass of the object is irrelevant (Tasks 4 and 5). In other words, although a majority of our subjects was able to recognize that mass is irrelevant for fall duration, they failed to see the irrelevance of mass in the relational balancing task. The involvement of the own motor action appears to have made the judgment task more difficult. The important role of the position of the barycenter (i.e., mass distribution, Task 6) went equally unnoticed in the falling and the balancing tasks. In general, knowledge about balancing properties and the underlying physical principles can be described as rather moderate. Do experts have a superior understanding of these principles?
2.2 Extending the case study: Comparing physics experts with non-experts
As all subjects had judged their physics knowledge to be rather limited, we chose to test a group with formal physics training on the balancing questions. We also tested a social science control group and added two new tasks. Tasks 1–3 were dropped from the study, while Tasks 4–6 were included. To test for a specific heuristic, namely that heavy objects are harder to balance, the following two tasks were added:
Task 7: The question "Does a weight help and if so, where would you place it?" was posed with respect to the much lighter wooden rod (m = 40g). Thus, Task 6 was replicated with a lighter rod. Finally, a more fine-graded question was added to assess by how much expert knowledge would be superior to normal knowledge, if at all:
Task 8: The eighth task showed four rods of the same material (steel, length 90cm). On three of them, a weight was attached at different positions (as shown in Figure 15). The subjects had to order them according to which would be easiest to balance on the tip of one finger. Note that the height of the barycenter matters. It is equally located in the center of rods B and D.
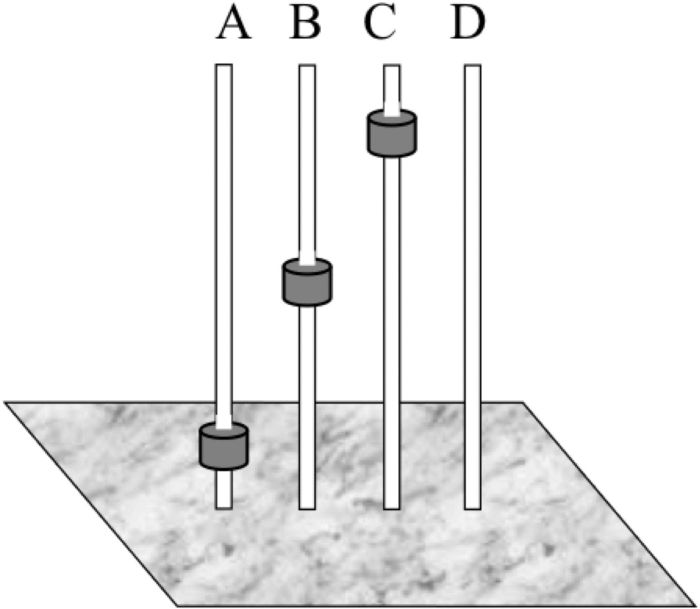 Figure 15: In Task 8, the four rods labeled A–D should be sorted according to the difficulty of balancing them. The correct order is C–B–D–A or C–D–B–A.
2.2.1 Methods detail
Participants: 84 college students, mainly of Psychology (69 women, 15 men, age ranging from 19 to 66 years) and 113 college students of Physics, Mathematics, and Chemistry (41 women, 72 men, age ranging from 18 to 27 years) were tested. The students of mathematics, physics, and chemistry estimated their knowledge in mathematics (M = 2.65, SD = 1.02) and physics (M = 2.68, SD = 1.07) to be moderate. The men estimated their knowledge of physics to be higher than did the women (t(111) = -4.34, p < .001). No difference was found for self-assessed maths skills (t(111) = -.22, p=.83).
A paper-and-pencil test was used to investigate the assumptions subjects held about the effect of various object properties on how easily the respective rods could be balanced. The test booklet included eight tasks: one per page. Each task consisted of a hypothetical scenario illustrated by a drawing. Different pseudo-random orders of the eight tasks were executed by all students. Tasks that built upon one another were kept in their logical order. Once a given task was finished, the page had to be turned. It was not permitted to go back to a previous page. Depending on the task, subjects had to make a binary choice (pick one or answer yes or no) or they had to grade their answers on a seven-point scale, according to how sure they were that one alternative would win over the other (certain win, very likely, somewhat likely, equal chance, somewhat unlikely, very unlikely, certain loss).
2.2.2 Results and discussion
Task 4 (equal length, different weight of the rods): Only 3.6 % of all social science students produced the correct solution and stated that the wooden and the steel rod would be equally hard to balance. Half of them thought that the steel rod would be easier to balance, and the remaining subjects chose the wooden rod. This corresponds well to the results obtained with the first large student sample. The physics students, in contrast, performed better albeit nowhere near perfection. 22% of them chose the correct answer. 21% thought the wooden rod would be easier to balance, and 57% thought the steel rod would be easier to balance. Thus, social scientists equally chose one or the other whereas physicists preferred the metal rod, and at most one fifth of them knew the correct answer (provided they were not just guessing better than the social science students).
Task 5 (equal weight, different length): Half of the social science students (53%) correctly thought that the longer rod would be easier to balance, and less than 2% thought that length did not matter. The physics students did noticeably better: 76% chose the longer rod, and only 20% thought the shorter rod would be easier to balance. 4% thought it would be the same with both rods.
In Task 6 (attach weight to steel rod): 60.7% of the social scientists thought that a weight would make it easier. When asked to place the weight, only 9.5% put it in the top third (for analysis purposes the rod was divided in three equal parts), and 44% placed it at the bottom third. Physics students fared a little better. A mere 44 % thought that a weight would improve balancing, but those who did correctly placed the weight at the top (40% of all physics students).
Task7 (attach weight to light wooden rod): Not surprisingly, performance was very similar to Task 6 (r= 0.76). If anything, the rod’s being lighter improved performance. 77.4% of the social scientists thought that a weight would make it easier. When asked to place the weight, only 19% put it in the top third. 45.2% put the weight in the bottom section, and the remaining students placed it in the middle section of the rod. Physics students fared a little better. 81% thought that a weight would improve balancing. However, the correct placement at the top was made by only 40%. Thus, in light of the results from Task 6, it seems that those who knew the correct answer were unimpressed by the weight of the rod. However, among those experts who merely guessed and suspected that weight would make a difference, they guessed so more often when the rod was lighter—increasing the salience of the weight.
Task 8 (order the rods): Social science students: According to the reasoning that a greater moment of inertia should facilitate balancing (note that this will not hold for much heavier rods), the correct order is C, B = D, A. Not a single subject produced this answer. 16.7% chose the order A, B, D, C; another 16.7% chose A, D, B, C. Only one subject considered a tie, albeit with a wrong ordering (B, D, A=C).
Physics students: Notably, 6% of the subjects did give the correct answer of CBDA or CDBA. 94% of the subjects answered incorrectly. Thus, the physics students were somewhat more knowledgeable than the social science students.
In sum, the errors we make in perceiving the balancing properties of simple objects are large. The important variable of mass distribution is ignored entirely. We plainly do not see how an object is best balanced until we try it out, even though we balance objects on a daily basis. Most if not all observers are unable to correctly imagine or remember past balancing acts. Formal physics training has surprisingly little effect on the paper-and-pencil task for assessing falling and balancing of rods. Note that the classical mechanics knowledge that would help solve the problem should have been held by all natural science students involved in the study. The fact that their answers were only slightly superior to novice intuitions is stunning. Why is the textbook knowledge of classical mechanics so frail that it has not been internalized, such as to inform our intuitive judgments or at least facilitate our textbook learning? Throughout evolution we had to handle and wield objects by balancing them. One might argue that such knowledge is not available to the ventral processing stream (see Milner & Goodale 2008). However, in further tests we confirmed that performance in our tasks did not improve when we let subjects wield a rod before filling out the questionnaire. Even though observers are able to feel how long a stick is when wielding it while being blindfolded (see Turvey & Carello 1995), they are unable to exploit the available perceptual cues that inform them about the balancing properties of an object. Thus, although we know shockingly little about balancing, it seems to be sufficient to guide our daily actions. We correctly see longer sticks as being easier to balance, but we fail to see the importance of mass distribution. Even when educated by formal physics training, our performance becomes only slightly more sophisticated. The gap between percept and reality closes merely by a small amount. It appears that the visual systems of different observers adopt different private models that often include rod length but not mass distribution.
2.3 The second case study: Visual cues to friction
Let us now look at another relational property that may have more serious consequences for our health: friction. If we misbalance an object, we may break it, but if we misjudge the slipperiness of the surface we walk on, we may get hurt. We need to avoid accidents on slippery ground and we have to estimate the force we need to apply to hold an object. Importantly, we often cannot wait for haptic cues to make this information available, but typically we have to make the underlying judgment of slipperiness on the basis of visual cues. The mere look of a wet slope may be all we have to guide our decision to tread forcefully or to hold on to a hand-rail and walk gingerly. The human ability to make such visual assessments of slipperiness is not well explored. We hold that this is because friction is not a simple surface property but rather a relational property, which can only be determined by relative characteristics of two surfaces. In other words, the fact that a surface is rough does not imply high friction, and the fact that a surface is smooth does not imply that it is slippery. Plastic for instance, can be very sticky on human skin but very slippery on wool or felt.
In what follows, we provide an overview of friction perception and briefly introduce venues to visual and haptic roughness perception. Then we report two experiments that were conducted to assess visual and haptic judgments of friction between surfaces.
2.3.1 Friction as a relational property vs. surface roughness
Some surfaces afford walking on whereas others do not. The information that allows the organism to make potentially critical decisions about where to tread or how strong a grip should be is based on a variety of perceptual dimensions (see e.g., Michaels & Carello 1981). Even when ample opportunity is given to haptically explore the surface, its felt roughness is not necessarily the same as the friction between the exploring hand and the surface, let alone the friction between the sole of the shoe and the surface. For instance, if our hand is moist we feel high friction when exploring a polished marble floor and at the same time we feel it to be very smooth. We may even perceive it as slippery—factoring in the effect of dry vs. moist hands.
Tactile competence regarding perceptual access to roughness of surfaces appears to be rather sophisticated (for a state-of-the-art review of haptic perception see Lederman & Klatzky 2009). In essence, haptic perception of surface roughness is better when the surface is explored dynamically as opposed to statically. Errors are generally rather small. More interestingly, several studies have demonstrated that cross-modal sensory information (e.g., vision and touch) can lead to better estimates of a texture’s roughness (e.g., Heller 1982). Other research has also shown that different sensory modalities are weighted about equally when estimating the roughness of textures (Lederman & Abbott 1981; Lederman et al. 1986).
Even by mere visual inspection, observers are able to see how rough a surface is (Lederman & Klatzky 2009). Such findings may have tempted researchers to unduly reduce friction to surface roughness. For instance, in the ergonomics context of accident analysis, slipperiness of work surfaces is typically operationalized by surface roughness, with the implicit or explicit assumption that roughness is good enough an approximation of friction (see e.g., Chang 1999; Chang et al. 2001; Grönqvist et al. 2001). However, friction is a rather complicated property between surfaces, for one because it is subject to change with the amount of pressure one applies or with the speed at which the surfaces move relative to one another. And people appear to have some difficulty judging friction (Joh et al. 2007).
Let us consider the case of a square block of cement on a large wooden surface. The heavier the block, the higher the friction coefficient. And the rougher the surface of the block the higher the friction coefficient. Thus, friction is a function of the force applied to a given surface, of area, and of roughness. Children and adults seem to be able to perceptually appreciate some but not all of the above-mentioned three components of friction. This intuitive knowledge develops with age. Adults have some insight into the multiplicative relation between the weight of an object and its surface texture in cases where the object is pulled across a surface, whereas nine-year-old children seem to assume a simpler additive relationship (Frick et al. 2006).
Friction is defined by the interaction between two surfaces, and its estimation requires knowledge about how different surfaces can interact. Thus, the seemingly simple visual percept that we have of a surface as “slippery” is a rather complex physical relation that pertains between properties of the surface and the contact object. Physically, slipperiness is indicated by the friction coefficient between two surfaces, which is usually measured by placing an object on an adjustable ramp. As the steepness of the ramp increases, one determines the angle at which the object starts to slip (static friction) or when the object starts to move uniformly (kinetic friction).
We can haptically judge the roughness of surfaces, and we are also able—to some degree—to haptically judge the friction between surfaces. Grierson & Carnahan (2006) have shown that individuals can haptically perceive slipperiness; that is estimates were significantly correlated with the friction coefficients between an object’s surface and skin. In their first experiment, they showed that tangential motion is required to judge the friction coefficient realistically. In a second experiment, they examined the force people applied to lift an object with a certain weight and surface structure. The applied force was often higher than necessary. Next to nothing is known about our ability to judge slipperiness based on visual information.
2.3.2 Slipperiness Experiment: Visual cues to friction of familiar surfaces
Vision has been shown to improve haptic judgments in endoscopic surgery. Within a simulated endoscopic environment, Perreault & Cao (2006) tested the effects of vision and friction on haptic perception by measuring for how long participants held on to the objects with the surgery tool. In a second experiment, participants had to compare the softness of pairs of simulated tissue. The experiments showed that visual and haptic feedback were equally important for the task. This suggests that visual cues can be exploited to judge slipperiness.
Presumably the main visual cue for predicting slipperiness or friction is shine (gloss, reflection, etc.) of a surface. Joh, Adolph, Campbell & Eppler (2006) explored which visual information can serve as a warning of low friction surfaces. They asked their participants which cues they use to identify slippery ground, and tested whether visual information is reliable for the judgment of slipperiness under different conditions (indoor and outdoor lightening). Walkers seem to rely on shine for selecting a safer, less slippery path, even though shine is not a very reliable visual cue for indicating slippery ground.
With two experiments we attempted to assess, in more general terms, the ability to perceive slipperiness. In our first experiment, we tried to find out to what extent visual and haptic information enables us to estimate friction between two surfaces and, in particular, how far visual cues in isolation decrease the ability to judge friction. In our second experiment, we manipulated the visual appearance of given surfaces to explore the effects of glossiness, contrast, and undulation on perceived friction.
Every day we encounter different types of surfaces with which we are in contact. In these situations we do not really think about how much force is to be exerted in order to create sufficient friction, be it between the fingers and the object we are grasping or between the sole of our shoes and the surface of the road we tread. Nonetheless, we rarely accidentally drop an object or slip on the road. Thus, we must have some degree of intuitive knowledge about the friction of surfaces. The experiment sought to find out, first, if this is really the case, and then which sensory information might guide our estimates of friction.
2.3.3 Methods detail
33 female and 31 male subjects between 18 and 52 years of age (M = 25.3; SD = 6.6) volunteered and were paid for participating in the study. All had normal or corrected to normal vision, and no one reported haptic impairments.
Ten different types of surfaces (see Figure 16) were glued onto separate thin quadratic tiles of wood with a size of 10 x 10cm. The surfaces were sheets of Teflon, pan liner, smooth and rough foam rubber, cloth, felt (soft and hard), and three different grades of sandpaper.
Two common reference surfaces were picked: human skin and smooth untreated wood. That is, the participants had to estimate the friction of the above ten surfaces with respect to one or the other of the two reference surfaces, skin or wood.
To measure the perceived friction, a ramp was used. Its slope could be adjusted to a steepness corresponding to the setting where the tile was judged to start sliding down. The ramp consisted of two wooden boards connected with a hinge. It was placed in front of the participant and could be continuously adjusted (see Figure 17). A measuring stick was attached to the top of the ramp such that the experimenter could easily record the height of the ramp while the participant saw only the unmarked side of the measuring stick. The height settings were then converted to slope angle, which in turn was used to determine the friction force acting between ramp and probe surface.
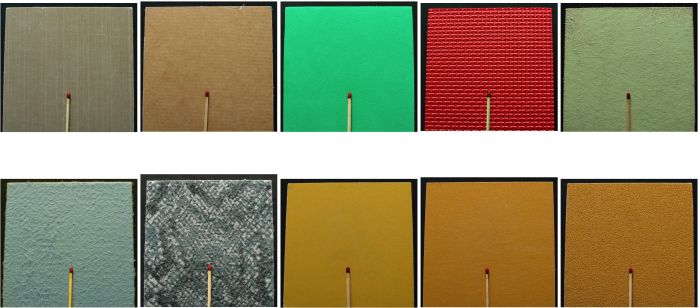 Figure 16: The ten materials used in the first experiment. Top row from left to right: Teflon, pan liner, smooth and rough foam rubber, cloth. Bottom row from left: felt (soft and hard), three different grades of sandpaper (320, 180, 40 in that order). All materials were mounted on identical square wooden tiles. The matchstick is shown to provide scale information, it was not there in the experiment.
The slope of the ramp used to estimate the friction of the different surfaces could be varied from 0 to 90 degrees. We computed coefficients of estimated static friction for the subsequent analyses using the following equation:
μH = FR / FN (friction coefficient = friction force / weight)
A 4 x 2 x 10 design was used, with one four-level between-subjects factor (Condition), and two within-subject factors, Reference Surface (two levels: skin and wood), and Surface Material (ten levels: Teflon, pan liner, smooth and rough foam rubber, cloth, felt (soft and hard), and three different grades of sandpaper).
 Figure 17: The ramp used to measure the estimated friction coefficients produced by the participants. The ramp had to be adjusted to the angle at which the respective tile would just about start to slide. In the case of skin as reference surface, observers were told to imagine the ramp to be their torso or to be covered with skin.
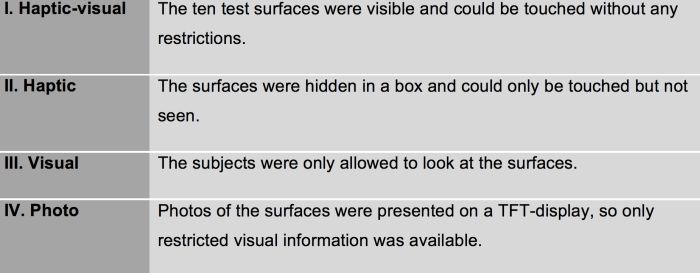
The factor Condition consisted of different instructions for exploring the surface materials (see Table 1). In the haptic-visual condition, observers were asked to touch the surfaces and to visually inspect them. In the haptic condition, the surfaces were hidden in a box at all times and could only be explored haptically. In the visual condition, observers were not allowed to touch the surfaces but could inspect them visually. In the photo condition, finally, observers merely viewed photographs of all ten surfaces. The same photographs as depicted in Figure 16 were used, with the exception that the match was not present. The photographs were the same size as the actual tiles (10 x 10 cm).
Subjects were allowed to look at the respective reference surface (skin or wood) before making a set of judgments based on this reference surface. They were also allowed and encouraged to touch the reference surface regardless of the condition in which they were tested. That is, even the group that could only visually inspect the test surfaces had visual and haptic experience of the generic reference surface. The ramp itself was not to be touched in this phase of the experiment, in order to ensure that the groups did not differ in how they explored the ramp. To envision the friction of skin, subjects were instructed to touch the inner side of their forearm, and to envision the friction of wood, they had a piece of wood (the same wood also used for the ramp) lying in front of them that they could touch. Half of the participants started with wood as reference and then after a short pause used skin as reference. The other half started with skin and then judged wood. Within each block, the order of the surface tiles was randomized separately for each observer.
Table 1: The four test conditions under which separate groups of subjects were asked to explore the material surfaces.
The procedure consisted of three parts. First, subjects had to estimate the friction of the ten materials, all presented successively and in random order. To do so, they had to adjust the slope of the ramp (see Figure 17). After inspecting the reference surface and the first tile, they had to set the ramp’s slope to the point where they expected the particular surface to just start slipping on the ramp. The surface tiles were never physically placed on the ramp. Then the remaining nine tiles had to be judged in the same manner.
In the second part, a short questionnaire was given to the subjects. Finally, the procedure was repeated with the other reference surface. The order of which reference surface was chosen first was counterbalanced such that half the observers started with wood and the other half started with skin.
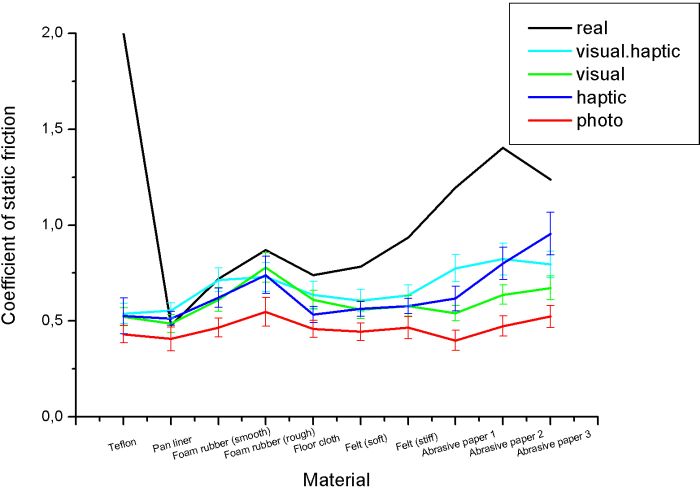 Figure 18: Actual and perceived coefficients of friction between skin and the respective materials. The solid black line corresponds to the actual angle of the slope at which the tile would indeed start to slide. The other lines represent subjective judgments averaged across all participants of each group respectively. Error bars indicate standard errors of the mean.
2.3.4 Results
Line graphs show the actual and the averaged estimated coefficients of static friction on skin (Figure 18) and on wood (Figure 19). With the exception of Teflon on skin, friction was perceived, albeit underestimated. In some cases, roughness appears to have guided perception. For instance, the different grades of sand paper produce similar friction because roughness and contact area trade off against one another. The coarse paper is rougher but at the same time provides fewer contact points than the fine paper. The resultant friction is in fact comparable. However, the coarse paper was mistakenly thought to produce more friction than the fine paper.
With skin as reference surface, haptic exploration improved performance but estimates remained far from perfect. Teflon in particular was grossly mis-estimated. The overall results showed significant main effects of Material (F(5.7, 342.4)=22.85, p<.001, partial η² =.27) and Reference Surface (F(1.0, 60.0)=17.80, p<.001, partial η² =.23). In addition, the effects of Condition were more pronounced for the reference surface of skin; the interactions of Material x Condition (F(17.1, 342.4)=2.92, p<.001, partial η² =.13) and between Material x Surface (F(7.9, 475.2)=2.87, p=.004, partial η² =.046) were significant. The interaction of Material x Surface x Condition was also significant (F(23.8, 475.2)=1.69, p=.023, partial η² =.078). Contrasts revealed that performance was poorer in the photo condition compared to the haptic condition (p=.023) and the haptic-visual condition (p=.007). The latter two did not differ significantly from one another or from vision alone.
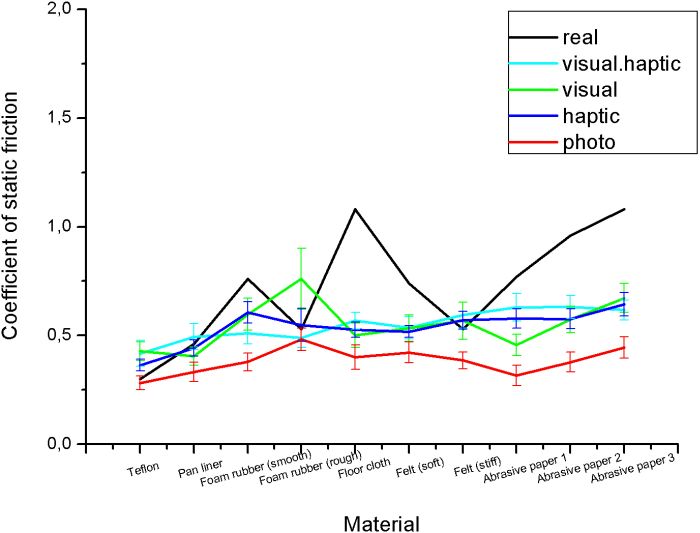 Figure 19: Actual and perceived coefficients of friction between wood and the respective materials. The solid black line corresponds to the actual angle of the slope at which the tile would start to slide. The other lines represent subjective judgments averaged across all participants of each group respectively. Error bars indicate standard errors of the mean.
The post-experimental questionnaire revealed that most participants attempted to use all available information and that they tried to find out which material they were confronted with. After identifying the material, they estimated the friction on the basis of their experience. Perhaps some erroneous estimates could be ascribed to such cognitive influences upon friction estimation.
In sum, static friction between a number of different materials and the reference surfaces skin and wood were picked up, but only to a limited degree. Vision alone does transport information about the relational property of friction. This ability to see friction is attenuated but still present when photographs are used. Thus, high-resolution detail appears to be crucial. Surprisingly, haptic cues were not superior to visual cues and even in combination only tended to improve performance. Friction is generally underestimated, with the exception of Teflon and wood, which was grossly underestimated. Multisensory information did not help compared to unisensory information. It appears that multiple information sources improve the perception of simple properties such as roughness (Lederman & Abbott 1981; Lederman et al. 1986), but fail to contribute in more complex cases of assessing friction. When visual information was reduced, not surprisingly, this affected friction judgments negatively. The photo condition produced notable judgment errors. It would be interesting to find out if this degradation could be compensated for by providing haptic cues together with the photographs. Note, however, that the photographs were able to produce estimates that correlated with actual friction. Thus, some information about roughness is preserved in the photo and can be accessed. The relational property of friction appears to be qualitatively different from and not reducible to roughness.
2.3.5 Friction experiment with manipulated visual appearance
The preceding experiment has shown that observers are able to gain some information about friction by visually inspecting the two involved surfaces together exhibiting this complex property. Given this ability, we should be able to isolate some of the relevant visual surface features upon which this ability is based. In a second friction experiment, we limited the reference surface to wood, and manipulated the visual properties of a select number of surfaces, namely Teflon, foam rubber, and sand paper. Among the changes in visual properties were factors that should influence perceived roughness and thereby potentially also friction, such as convolving the picture with a wave pattern, or changing the contrast in the picture.
2.3.6 Method detail
55 volunteer subjects (23 men and 32 women) participated in the study. They were recruited at the campus of the Johannes-Gutenberg University of Mainz and at a nearby supermarket. All participants were naive with respect to the purposes of the experiment. Their average age was 31.8 years (SD = 12.6 and a range from age 16 to 59).
We took some of the pictures of the tiles used previously. The pictures were taken on a Fuji Finepix S5500 digital camera (four mega-pixels) with a resolution of 1420 x 950 pixels. One reference picture each of coarse sandpaper, structured foam rubber, and Teflon were chosen. Then these reference pictures were modified using four special effects provided by Adobe Photoshop Six. Five visual effect conditions (Filter) were thus created for each of the three materials (see Figure 20 for the case of sand paper):
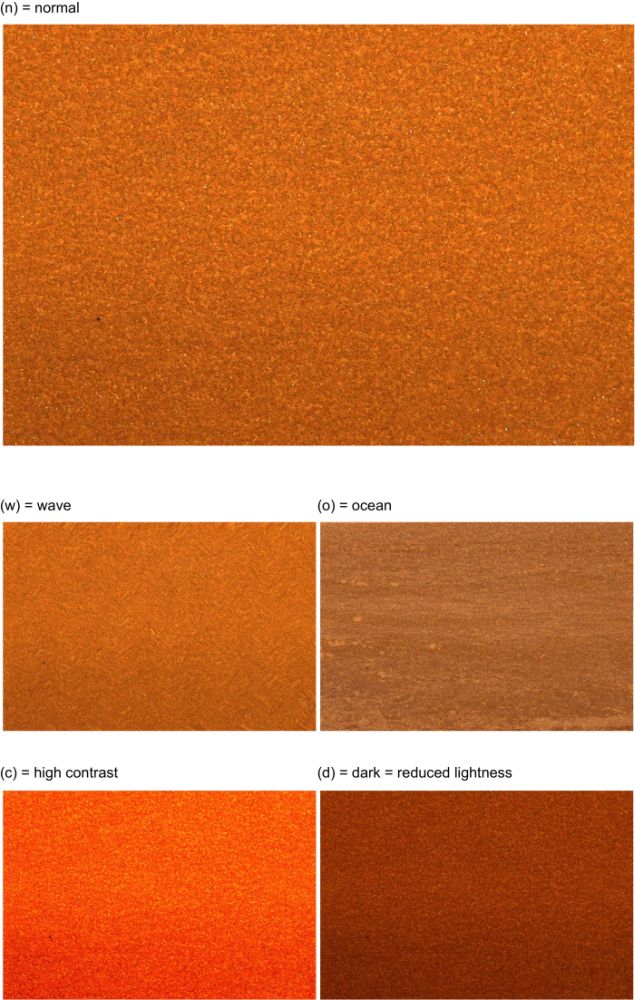 Figure 20: The reference picture (n) of the sand paper tile, and the four filter effects applied to the reference picture: ocean effect (o), wave effect (w), reduced lightness (d), and enhanced contrast (c). Note that all pictures were of equal size in the experiment.
-
Normal: The reference picture was the original photo of the surface without any special effect.
-
Ocean: The original photo was convolved with the structure of an ocean surface. A photograph showing the ocean from above with its waves was put as a new layer upon the original photograph with an opacity value of 25%. It added a look reminiscent of structured wood to the photograph. We hypothesized that the added structure would increase perceived friction.
-
Wave: This filter introduced a wave pattern into the picture. This distortion effect was used with the parameters Number of Generators (5), Wavelength (Minimum 10 Maximum 120), Amplitude (Minimum 5, Maximum 35), Scale (horizontal 100%, vertical 100%), Repeat Edge Pixels (On), and Type (Sine). This filter distorts the original structure in the pattern of sine waves. We hypothesized that here, the added structure would not change perceived friction because waves are regular and smooth compared to the ocean texture.
-
Dark: The lightness of the surface was reduced uniformly by 50% (parameter setting: 50). We hypothesized that this would reduce detail, which would decrease perceived friction.
-
Contrast: The contrast was uniformly enhanced such that the according parameter was raised to +50. We hypothesized that the added contrast would emphasize roughness and thereby increase perceived friction.
The photos were printed on high-quality photo paper and shown to the volunteers in succession. The “normal” reference version of one material was always shown first, and then four different versions of the same material were presented in changing pseudo-random orders, for each material respectively. All possible sequences of the materials were presented to different observers. They were asked to imagine the surface shown on the photograph as being the surface of the ramp itself. The same ramp as before was used (see Figure 17), but subjects were not allowed to touch its actual wooden surface. Then they were asked to decide how steep the ramp would have to be set for a wooden tile to start sliding down on the shown surface. The tile of wood was shown to them beforehand and they were asked to touch it. Then they had to put the ramp at the angle at which they thought the wooden tile would just start to slide. As before, we measured the height of the ramp setting in centimetres. With this information, we calculated the angle with sin(α) = height / ramp length = height / 44cm and finally the resulting estimated friction coefficient for all surfaces.
2.3.7 Results
Figure 21 shows the estimated friction coefficients for all three materials averaged across all filters and across the respective reference surface. Friction between wood and foam rubber was judged to be highest, friction with sandpaper was judged intermediate, and friction with Teflon was judged to be smallest. Figure 22 depicts the overall averages by Filter (visual effect). Figure 23 shows the interaction between Material and Filter.
A repeated measurement analysis of variance with Material and Filter as within-subject factors and gender as between-subjects factor was conducted on the judged friction coefficients; F-values were corrected by Huynh-Feldt as necessary. Material had a significant effect on estimated friction (F(2, 106)=9.54, p<.001, partial η² =.15). Foam rubber and paper did not differ, but both were judged to produce more friction than Teflon (p<.001 and p<.003 respectively).
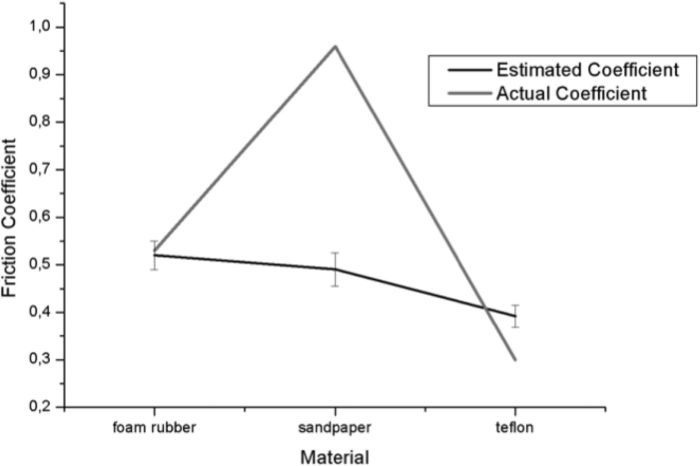 Figure 21: Estimated friction coefficients for the three materials independently averaged across all filters, and the actual coefficients for the three materials on wood. Error bars indicate standard errors of the mean.
The factor Filter also had a significant influence on the estimation of friction (F(4, 212)=5.351, p=.001, partial η² =.092). The unfiltered stimuli were judged to produce the smallest amount of friction, and all filters appeared to increase the subjective coefficient of friction. Figure 22 shows the estimated friction for all five filters averaged across all three materials. The contrasts between the estimated friction coefficient values for “normal” and “ocean” (p<.024), “normal” and “dark” (p<.001) and “normal” and “contrast” (p<.023) were significant. Because of the sometimes variable judgments, the individual contrasts between “normal” and “wave” as well as “contrast” and “dark” failed to reach significance.
 Figure 22: Estimated friction coefficients for the five filters averaged across the three materials. Error bars indicate standard errors of the mean.
We also found a significant interaction between the factors Material and Filter (F(8, 424)=3.99, p=.002, partial η² =.070). As visible in Figure 23, this interaction was mainly due to the immunity of Teflon to all filter manipulations and to the special effect of the increased contrast on foam rubber. Now let us have a closer look at the three materials and how they fared with the different filters. Participants could judge the friction between wood and the shown surfaces rather well, with the exception that the friction of sandpaper was underestimated. For some reason some of the grittiness and roughness of sandpaper has been lost in the photos, whereas no such loss occurred for foam rubber and Teflon. To the experimenter, the surface of sandpaper also did not look as rough as it did in real life.
Teflon on wood was clearly judged to be the most slippery surface. Interestingly, the estimated differences between the Teflon reference and its filter-treated variants were very small compared to the other materials (see Figure 23). Presumably, Teflon generally looks so slippery that a ceiling had been approached and the filters could not significantly change the low friction ratings of Teflon. The surfaces that were treated with “ocean” looked like rough wood; the manipulations “contrast” and “dark” seemed to make the structure clearer. The filter “wave” had a smaller influence on the estimations. Participants often said that they found it difficult to classify the wave-treated surface.
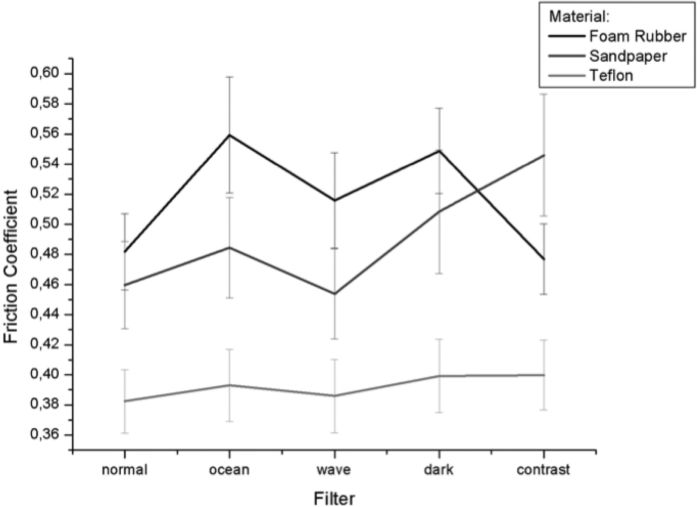 Figure 23: Interaction between the two factors Material and Filter. Error bars indicate standard errors of the mean.
The results of this experiment clearly show that irregular additional structure—as introduced into the surface by convolving the picture with the ocean pattern—causes the perception that the surface is less slippery. This was the case for all surfaces that were not extremely slippery to begin with. Other than hypothesized, reducing the lightness of the surface also tended to produce higher ratings of friction. Increased contrast, on the other hand, produced mixed results. Sandpaper with increased contrast was judged to cause more friction. Contrast had a smaller but similar effect on Teflon. However, when applied to foam rubber, increased contrast had no effect. Taken together, these effects demonstrate that visual aspects of a surface, such as its microstructure, its lightness, and its contrast co-determine how slippery it is judged to be with respect to a given reference surface. Note, however, that the reference surface was always wood, and simple roughness judgments may have guided the friction estimates.
To summarize the friction case study, we conducted two experiments to assess whether observers are able to visually perceive the complex relational property of friction between two surfaces even when not allowed to touch the surfaces. They were able to do so with limitations. Observers generally tended to underestimate the degree of friction. An underestimation of friction as observed in these two studies could be regarded as a conservative approach to judging the grip force required to successfully grasp objects. Using more force than necessary rarely leads to disaster (consider raw eggs), whereas too little grip force causes an object to slip out of our hand and fall.
The first friction experiment compared judgments based upon visual inspection alone, and then after visual and haptic inspection. Vision in and of itself provides valuable information; additional haptic information added surprisingly little. The second experiment explored the particular visual properties that make surfaces look more or less slippery, but note that the reference surface always remained unchanged. Subjects likely differentiated between surfaces of different roughness insofar as roughness (simple property) and friction (relational property) were correlated. Errors were large in particular when the relational property to be judged was variable. Perceiving Teflon as very slippery (with respect to skin) when it is indeed quite the opposite is a grave perceptual error, but it is not very meaningful to call the error an illusiond. A perceptual miscategorization of the relational property of friction between surfaces might be a more appropriate description.